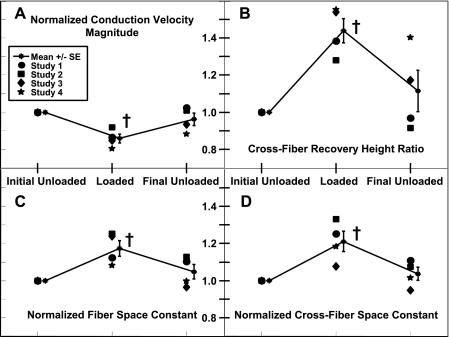
Fig. 6.
Individual data points and means ± SE of measured CV (A), the measured cross-fiber stimulus-response recovery height ratio (B), measured fiber space constant (C), and measured λXF (D). All parameters were measured concurrently within an individual experiment and loading state. All values are normalized by initial unloaded values. †P < 0.05 compared with the initial unloaded value.

