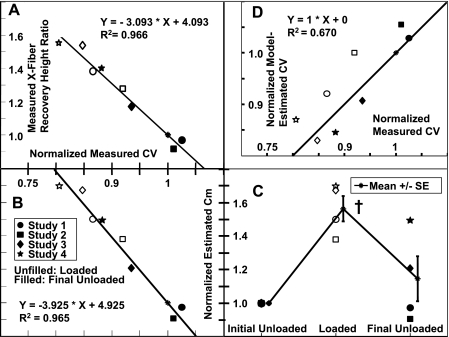
Fig. 7.
A: correlation between changes in concurrently measured CVs and cross-fiber stimulus-response recovery height ratios. B: correlation between changes in measured CVs and effective Cm values estimated from the fit to model data. C: individual data points and means ± SE of estimated Cm. D: correlation between changes in measured CVs and model-estimated CVs, with regression to unity. All values were normalized by initial unloaded values. †P < 0.05 compared with initial unloaded values.

