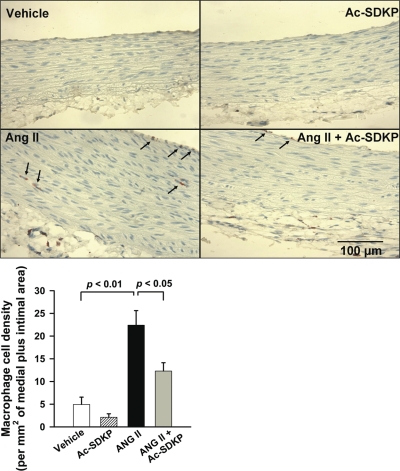
Fig. 7.
Effect of Ac-SDKP on ANG II-induced macrophage infiltration in the aorta. Top: representative cross sections of aortas from rats treated with vehicle, Ac-SDKP, ANG II, or ANG II + Ac-SDKP. ED-1-positive cells (stained reddish-brown) are indicated by arrows. Magnification ×400. Bottom: quantitative analysis of macrophage infiltration, represented by the number of ED-1-positive cells per mm2 of intimal + medial area. n = 5/group.

