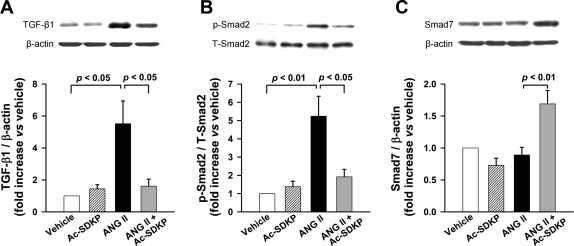
Fig. 9.
TGF-β1 and Smad2 and -7 expression in the aortas of rats treated with vehicle, Ac-SDKP, ANG II, or ANG II + Ac-SDKP. Top: representative immunoblots. Bottom: quantification graphs. A: TGF-β1 expression. B: Smad2 phosphorylation. T-Smad2, total Smad2. C: Smad7 expression. Values are means ± SE; n = 5 or 6/group.

