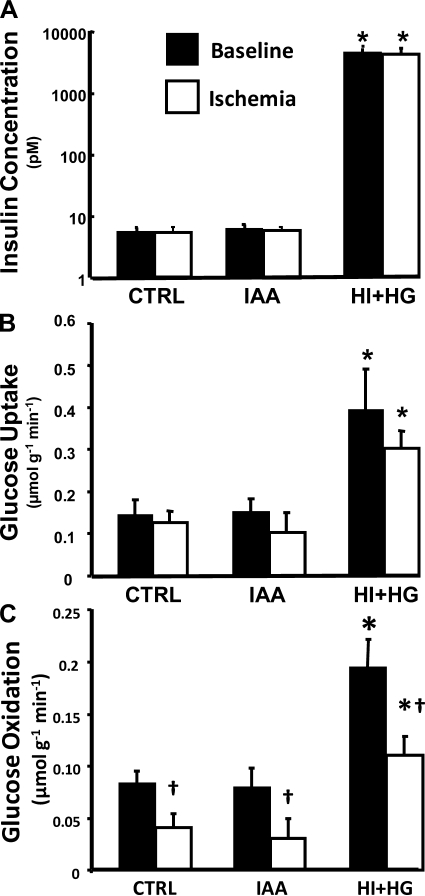
Fig. 1.
Arterial insulin concentration (A), myocardial glucose uptake (B), and glucose oxidation (C) for the control (CTRL), iodoacetate (IAA), and hyperinsulinemia and hyperglycemia (HI + HG) groups under baseline and during ischemia. *P < 0.001 vs. CTRL and IAA under the same condition; †P < 0.05 vs. baseline within the same treatment group.

