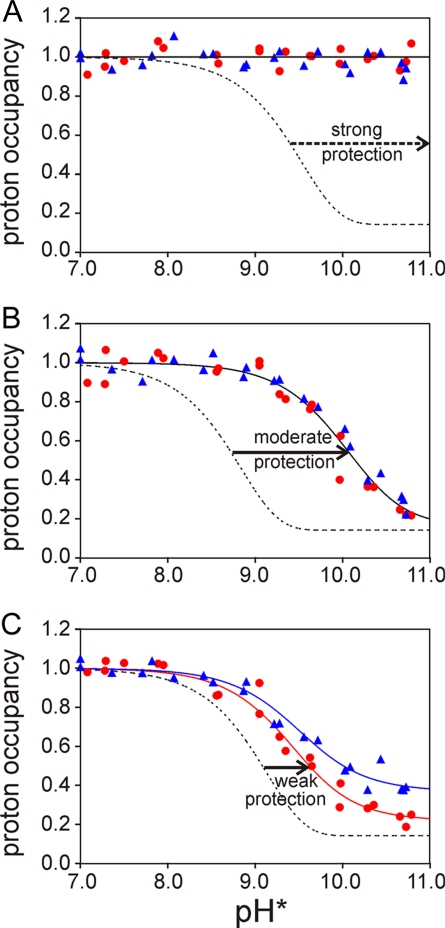
Fig. 1.
Representative plots of amide proton occupancy in partially refolded apomyoglobin as the 3.6-ms labeling pulse pH is varied from 7.0 to 10.7. (A) V10 (A helix), representative of the highly protected residues (class S). (B) A143 (H helix), representative of moderately protected residues (class M). (C) V66 (E helix), representative of weakly protected residues (class W). Red circles and blue triangles represent the data obtained at tf of 0.4 and 6 ms, respectively. The red lines and blue lines represent the fits to the 0.4- and 6-ms data, respectively, obtained by using Eqs. 2–5. The red and blue lines are coincident in A and B. The dotted lines show the expected curves for unprotected amides at tp of 3.6 ms.

