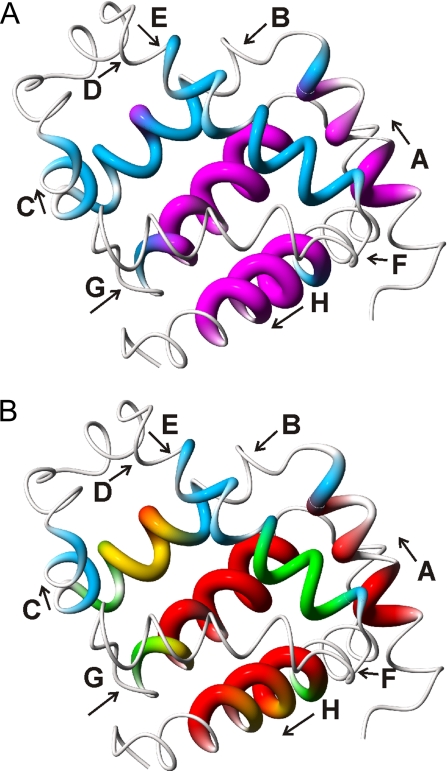
Fig. 4.
Location of the most rapidly protected amides. (A) Distribution of fully and nonequilibrated amides in the 0.4-ms intermediate ensemble. The structure of holomyoglobin (38) is represented as a tube of varying radius. Residues whose amides are fully equilibrated after 0.4 ms of refolding, i.e., for which [NHopen] has reached the equilibrium value, are depicted in magenta with increased tube radius. Residues for which [NHopen] has not reached the equilibrium values and which are fluctuating between folded and unfolded states are depicted by a thinner blue tube. Very thin tubes represent regions that do not exhibit exchange protection and probably remain unstructured in the folding intermediate. (B) Mapping of kcl values onto the holomyoglobin structure. Closing rates are depicted by variations in color and tube radius. Red, kcl > 9,500 s−1; yellow, 5,000 < kcl < 9,500 s−1; green, 2,500 < kcl < 5,000 s−1; blue, kcl < 2,500 s−1. This figure was prepared by using MolMol (39).

