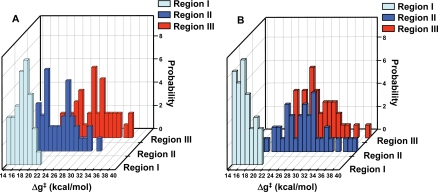
Fig. 4.
The distribution of activation barriers for the monomer (A) and dimer (B) for different regions of the folding landscape. Region I was generated from the native mMjCM and EcCM structures; region II corresponds to low energy structures obtained by the simplified model (Fig. S1); and region III corresponds to higher-energy structures from the simplified landscape (Fig. S1). The average rmsd of structures in these regions are 0.9, 3.6, and 5.3 Å, respectively. The figure presents the probability of having a given value of the activation barrier (Δg‡) as a function of the value of the activation barrier.

