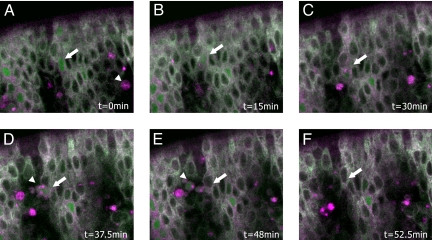
Fig. 3.
Apoliner reports on caspase activity in vivo. Frames from a time-lapse movie tracking an Apoliner-positive cell in a live embryo (see Movie S1). Times are indicated in minutes. Caspase activity is detected by the presence of GFP in the nucleus and the red membrane. One Apoliner-positive cell is marked with an arrow in A–E. In A, this cell appears morphologically normal, although Apoliner is already cleaved. Later, it shrinks (C and D), before being taken up by hemocytes (D and E), and removed from the epithelium. In F, the arrow points to the original position of the removed cell. The arrowhead in D and E points to the hemocyte that engulfed this particular dying epidermal cell.

