Fig. 4.
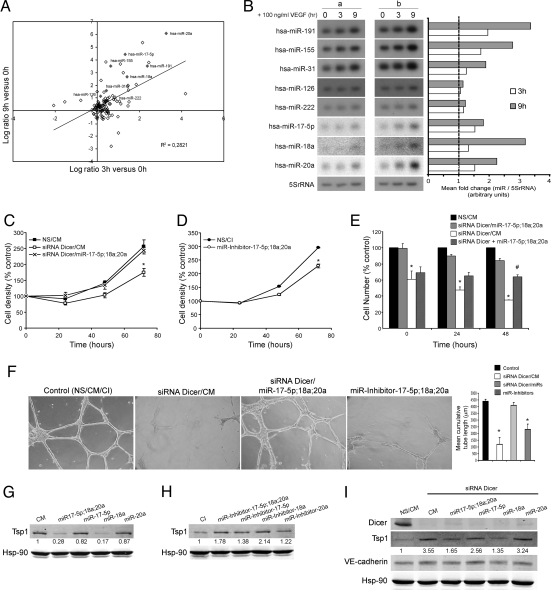
VEGF regulation of miRNA expression in ECs. (A) Data are the Log2 ratio of miRNA expression 3 and 9 h after VEGF treatment. hsa-miR-191, hsa-miR-155, hsa-miR-31, hsa-miR-126, hsa-miR-222, hsa-miR-7-5p, hsa-miR-18a, and hsa-miR-20a are highlighted in grey. (B) Confirmation and quantification of miRNA expression by Northern blotting. 5S rRNA served as a loading control. a and b denote samples from two different isolations of HUVECs. (C) Dicer knockdown decreases EC growth, an effect rescued by hsa-miR-17-5p, hsa-miR-18a, and hsa-miR-20a. EC (EA.hy.926 cells) were transfected with control nonsilencing and control mimic sequences (NS/CM) or Dicer siRNA in the presence of CM (siRNA Dicer/CM) or Dicer siRNA in the presence of a mix of specific mimics. (D) Targeting components of the miR-17-92 cluster reduces EC growth. ECs were transfected as above with control inhibitor sequence (CI) or a mixture of specific miRNA inhibitors and cell density was quantified. Data are expressed as percentage of control at day 0. (E). ECs were transfected as described in C for 48 h. Cells were incubated in medium without serum for 12 h (time = 0 h) and subsequently incubated in the presence of VEGF for 24 or 48 h. siRNA Dicer + miR-17-5p;18a;20a indicates cells that were initially transfected with Dicer siRNA for 48 h then transfected with miRNA mimics at the time of VEGF treatment. At the indicated time points, cell number was quantified. Data are expressed as percentage of control (NS/CM). (F) HUVECs were transfected as indicated in C. After 60 h, cells were seeded on a growth factor-reduced Matrigel in the presence of FBS (0.5%) and VEGF (100 ng/ml). Cumulative sprout length of capillary-like structures was quantified after 16 h. Data are from n = 3 experiments. (Magnification: ×10.) (G and H) Western blot analysis of Tsp1 levels in ECs transfected with CM, a mix of specific mimics, or individual specific mimics as indicated in G or transfected with CI, a mix of specific miRNA inhibitors, or individual specific miRNA inhibitors as indicated in H. Hsp-90 was used as loading control. (I) Western blot analysis of Dicer and Tsp1 expression levels in ECs transfected as indicated in C and in the presence of Dicer siRNA. VE-cadherin served as an EC marker and Hsp-90 served as loading control. Data are reported as the mean ± SEM. * and #, P < 0.05, by Student's t test.

