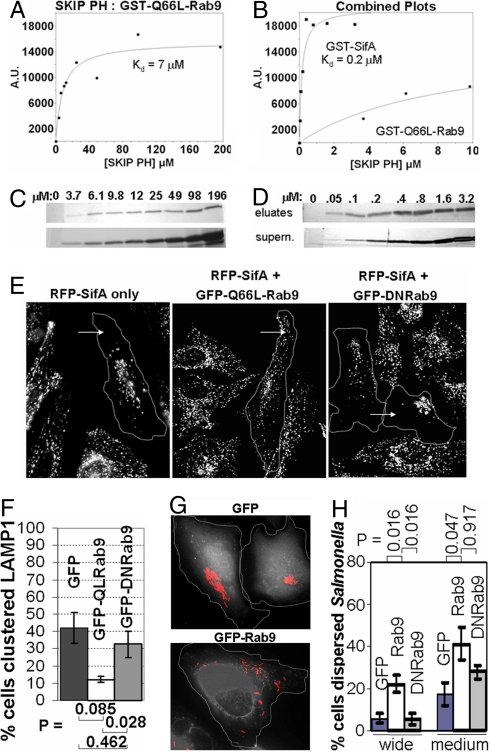
Fig. 3.
SifA binds more tightly to SKIP PH than Rab9, but SifA-dependent cellular phenotypes can be antagonized by Rab9 overexpression. (A–D) For SKIP PH pulldowns, resin loaded with GST-Q66L-Rab9 (A and C) or with GST-SifA (B and D) was incubated with the indicated concentrations of recombinant SKIP PH protein. SKIP PH protein from pulldown elutions or supernatants (≈10%), was separated by SDS/PAGE and visualized by Coomassie (GST-Q66L-Rab9) or by silver stain (GST-SifA). Eluted SKIP PH protein was quantified by densitometric scanning, and net intensity (A.U.) (y axis) was plotted vs. concentration of SKIP PH added ([SKIP PH]) (x axis). (A and B) Plotted results with data points (filled circles) and fits (solid lines). For comparison, part of the Rab9 binding curve from A was also superimposed onto B. (E) HeLa cells coexpressing either GFP, GFP-Q66L-Rab9, or GFP-DNRab9 were fixed and stained for LAMP1 (white). Transfected cells are outlined with a dotted line. (F) Bar plot showing quantitation of percentage of cells with altered peripheral LAMP1 distribution. (G) HeLa cells expressing either GFP, GFP-Rab9, or GFP-DNRab9 (white) were infected with mCherry Salmonella (red). (H) Bar plot showing percentage of HeLa cells with medium or wide dispersal of Salmonella for cells overexpressing GFP, GFP-Rab9 or GFP-DNRab9 (n = 5 experiments) (see Methods). P values were obtained by using the Wilcoxon–Mann–Whitney test. Error bars are represented as ± SEM.

