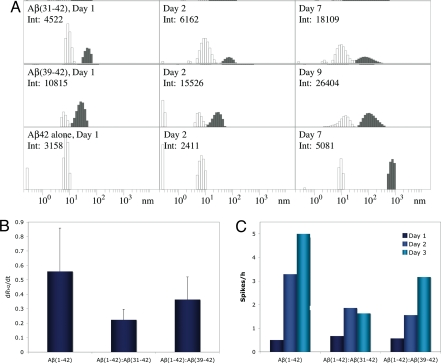
Fig. 3.
CTF effect on Aβ42 assembly. (A) Representative distributions of Aβ42 in the absence or presence of CTFs immediately after preparation (Left), on the next day (Center), and after 7 or 9 days (Right). White bars represent P1 particles. Gray bars represent P2 or larger particles (in the case of Aβ42 alone). Days of measurement and the total scattering intensities in counts per second are shown in the upper left corner of each panel. Only intensities within the same row are directly comparable with each other. (B) Growth rates of P2 particles (dRH2/dt) in the absence or presence of CTFs. (C) Average number of intensity spikes per hour during the first 3 days of measurement in the absence or presence of CTFs.

