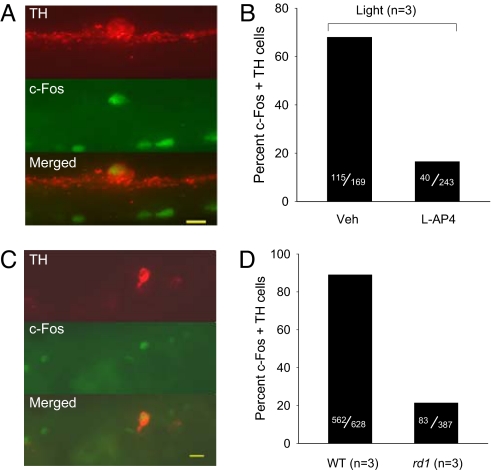
Fig. 4.
Light-induced c-Fos gene expression of DA neurons in vivo. (A and B) Light-induced c-Fos induction in the presence and absence of L-AP4. (A) Fluorescence micrographs for immunolocalization of TH (red), c-Fos (green), and colocalization (yellow), calibration bar = 10 μm. Veh, vehicle. (B) Percent c-Fos/TH double-labeled cells in the absence and presence of 100 μM L-AP4. (C and D) Light induced c-Fos gene induction in DA neurons of rd1 mice. (C) Fluorescence micrographs for immunolocalization of TH (red), c-Fos (green), and colocalization (yellow), calibration bar = 12 μm. (D) Percent c-Fos/TH double-labeled cells in WT and rd1 retinas.

