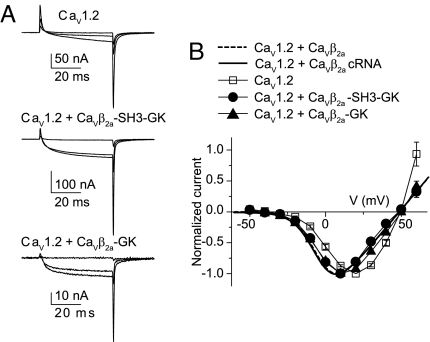
Fig. 2.
Refolded CaVβ2a-GK and CaVβ2a-SH3-GK shift the current–voltage relationship of CaV1.2-mediated currents. (A) Representative gating and ionic currents traces from oocytes expressing CaV1.2 cRNA alone and after injection of either CaVβ2a-SH3-GK or CaVβ2a-GK. Currents were evoked by 50-ms pulses to −30, 0, and +30 mV from a holding potential of −80 mV. (B) Normalized current–voltage plot from oocytes expressing the subunit combinations CaV1.2 cRNA (n = 11), CaV1.2 + CaVβ2a-SH3-GK (n = 14), and CaV1.2 + CaVβ2a-GK (n = 16). For comparison, normalized current–voltage curves for CaV1.2 + CaVβ2a, either injected as a protein (dashed line) or co-injected as cRNA (continuous line) are shown (see Table S1 for details).

