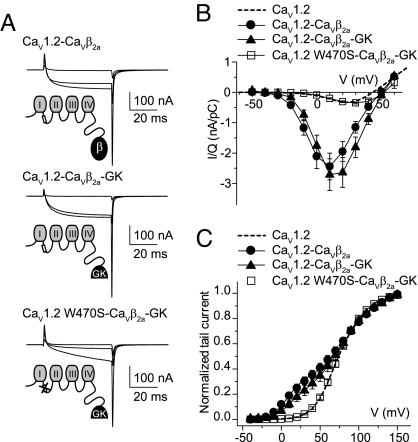
Fig. 3.
CaVβ2a-GK covalently linked to CaV1.2 WT, but not to CaV1.2 W470S, increases peak current amplitudes and shifts the current–voltage relationship. (A) Representative gating and ionic current traces from oocytes expressing CaV1.2 WT covalently linked to either CaVβ2a (CaV1.2-CaVβ2a) or CaVβ2a-GK (CaV1.2-CaVβ2a-GK), and CaV1.2 W470S covalently linked to CaVβ2a-GK (CaV1.2 W470S-CaVβ2a-GK). Currents were evoked by 50-ms pulses to −30, 0, and +30 mV from a holding potential of −80 mV. (B) Ionic current from oocytes expressing the different constructs were normalized by charge movement (I/Q) and plotted versus voltage. For CaV1.2-CaVβ2a, the peak I/Q was 2.44 ± 0.44 nA/pC (n = 17); for CaV1.2-CaVβ2a-GK, it was 2.71 ± 0.52 nA/pC (n = 17); and for CaV1.2 W470S-CaVβ2a-GK, it was 0.35 ± 0.03 nA/pC (n = 17). For comparison, the average I/Q from 15 oocytes expressing CaV1.2 alone are shown as dashed lines (0.30 ± 0.06 nA/pC). (C) Normalized tail currents from oocytes expressing the different constructs. The continuous lines correspond to the fit of the sum of two Boltzmann distributions, and the dashed line corresponds to the fit obtained from CaV1.2-expressing oocytes (see Fig. S4 and Table S1 for details). The fit to CaV1.2 W470S-CaVβ2a-GK was excluded from the plot for clarity.

