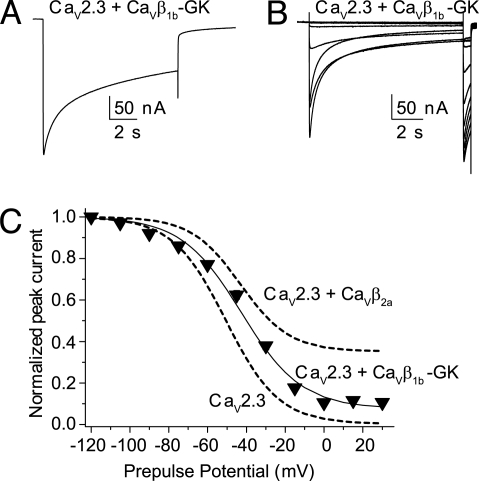
Fig. 6.
CaVβ1b-GK slows inactivation of CaV2.3-mediated currents and shifts the steady-state inactivation toward more depolarized potentials. (A) Representative current traces from a CaV2.3-expressing oocytes injected with CaVβ1b-GK during a 10-s pulse to 0 mV from a holding potential of −90 mV. (B) Current traces evoked with the steady-state inactivation pulse protocol from the same oocytes shown in (A). (C) Average steady-state inactivation curve from oocytes expressing CaV2.3 and injected with CaVβ1b-GK protein (n = 14). For comparison, the Boltzmann distributions that best describe CaV2.3 and CaV2.3 + CaVβ2a data from Fig. 5 also are shown (dashed lines). The V½ value for CaV2.3 + CaVβ1b-GK was significantly different from that measured in oocytes expressing CaV2.3 alone (t test; P < .01) (see Table S2 for details).

