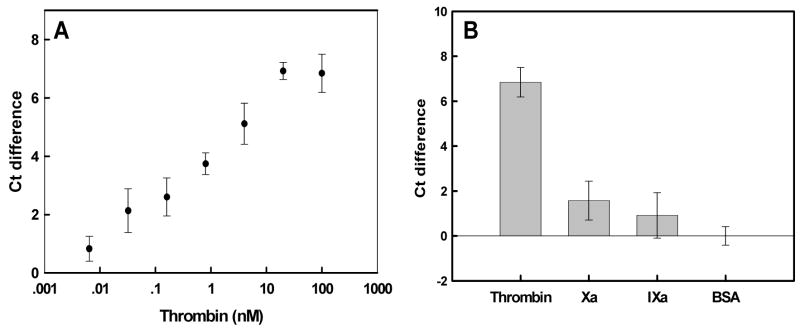
Figure 6.
Thrombin detection against a background of cell lysate. (A) Ct differences as a function of added thrombin concentration. Reactions and signal determination were as in Figure 5, except that ligation reactions were carried out in the presence of 1 μg/mL 293T fibroblast cell lysate. Ct differences were calculated relative to BSA in lysate. (B) Specificity of response. BSA (0.002%) in lysate was used as a negative control. Error bars were derived from at least four determinations.

