Figure 7.
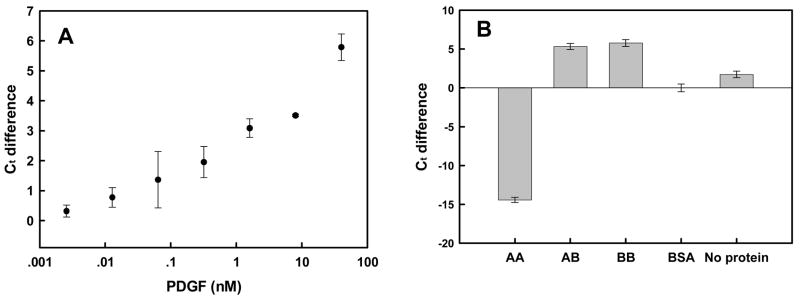
Real-time PCR amplification of PDGF-dependent ligation reactions. (A) Ct differences as a function of PDGF concentration. Reactions and signal determination were as in Figure 5. Ct differences were calculated relative to BSA alone (0.004% final). (B) Specificity of response. Ligation reactions were carried out in the presence of different PDGF isoforms (40 nM). Either BSA or no protein controls were also carried out. Error bars were derived from at least three determinations.

