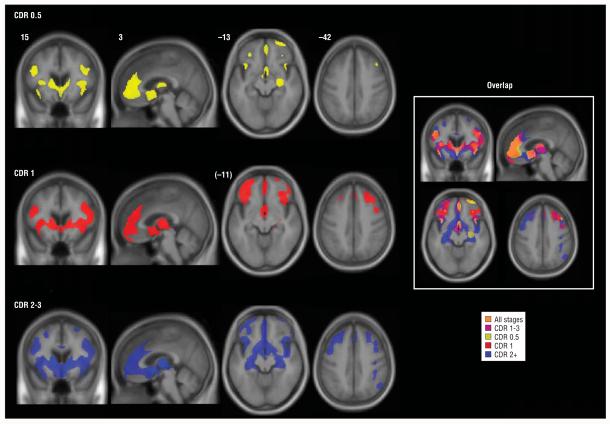
Figure 1.
Stage-specific gray matter atrophy in behavioral variant frontotemporal dementia. Maps of significantly atrophied voxels (each group vs controls: P<.05, whole brain corrected) are overlaid on the study-specific brain template, using an inclusive gray matter mask for visualization purposes only. On the right, the same color scheme is overlaid on a single image to show overlap of stage-related atrophy patterns. The right side of the axial and coronal images corresponds to the right side of the brain. Numbers indicate the MNI (Montreal Neurological Institute) coordinate of the template brain magnetic resonance image shown. CDR indicates Clinical Dementia Rating; CDR 1-3, mild to severe; CDR 0.5, very mild; CDR 1, mild; and CDR 2+, moderate to severe.

