
Figure 2.
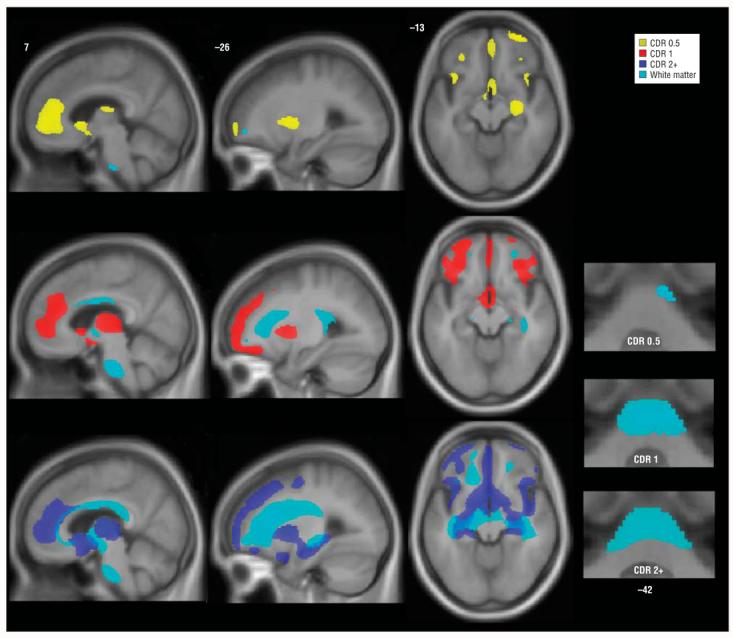
Stage-specific white matter atrophy in behavioral variant frontotemporal dementia. Areas of white matter loss are overlaid on gray matter atrophy maps for each stage. Bottom right images show basal pontine white matter loss that involves the middle cerebellar peduncles at later stages. Images are otherwise displayed as in Figure 1. Numbers indicate the MNI (Montreal Neurological Institute) coordinate of the template brain magnetic resonance image shown. CDR indicates Clinical Dementia Rating, CDR 0.5, very mild; CDR 1, mild; and CDR 2+, moderate to severe.