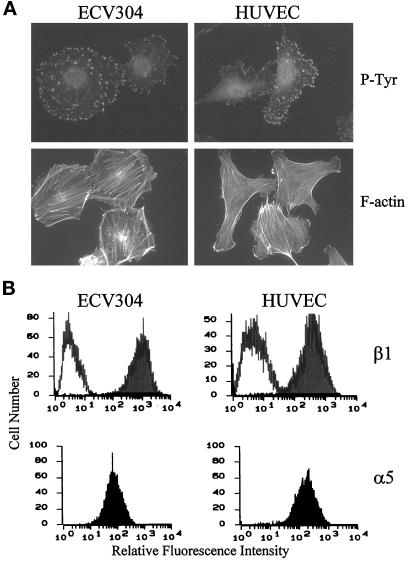
Figure 1.
Morphology and integrin expression of ECV304 cells and HUVECs. (A) Morphology. Cells were maintained in culture as described in MATERIALS AND METHODS. Fixed, permeabilized cells were stained for phosphotyrosine to visualize focal contacts and for actin to visualize stress fibers. (B) Flow cytometry. For the analysis of integrin expression, viable cells were stained with anti-β1 (top) or anti-α5 (bottom) antibodies. Shaded histograms represent cells treated with anti-integrin subunit antibodies; open histograms show the staining of negative controls (no primary antibody). The ordinate displays cell number, and the abscissa displays relative fluorescence intensity on an arbitrary scale.

