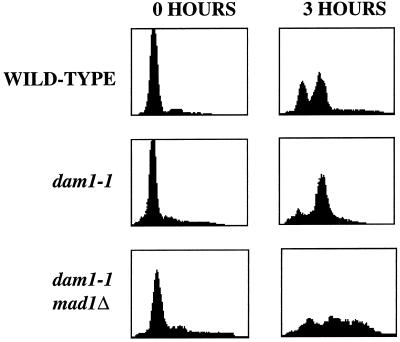
Figure 5.
DNA content of wild-type, dam1-1, and dam1-1mad1null cells. Left panels (0 h), flow cytometric data of cells at α-factor arrest; right panels (3 h), flow cytometric data (performed as in Figures 1 and 3) of cells 3 h after release from α-factor to the nonpermissive temperature. Thirty-four percent (n = 400 cells) of dam1-1, mad1Δ cells were multibudded at this time point compared with 0% for both wild-type and dam1-1 cells.

