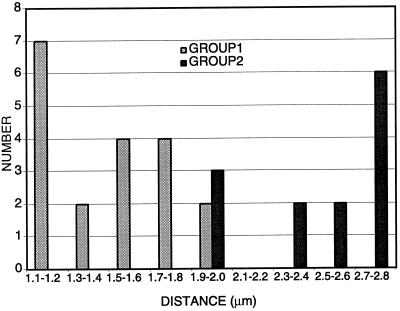
Figure 8.
Transition of myc-Dam1p localization from one to two foci. Bar graph of spindle lengths in cells with the following patterns of myc-Dam1p staining. GROUP 1, myc-Dam1p localization as an uninterrupted bar between the SPBs (n = 19; average = 1.5 μm; SD = 0.3); GROUP 2, myc-Dam1p localization as two staining regions adjacent to the SPBs (n = 13; average = 2.4 μm; SD = 0.3). Spindles were measured using Slidebook software with an error of ±0.1 μm.

