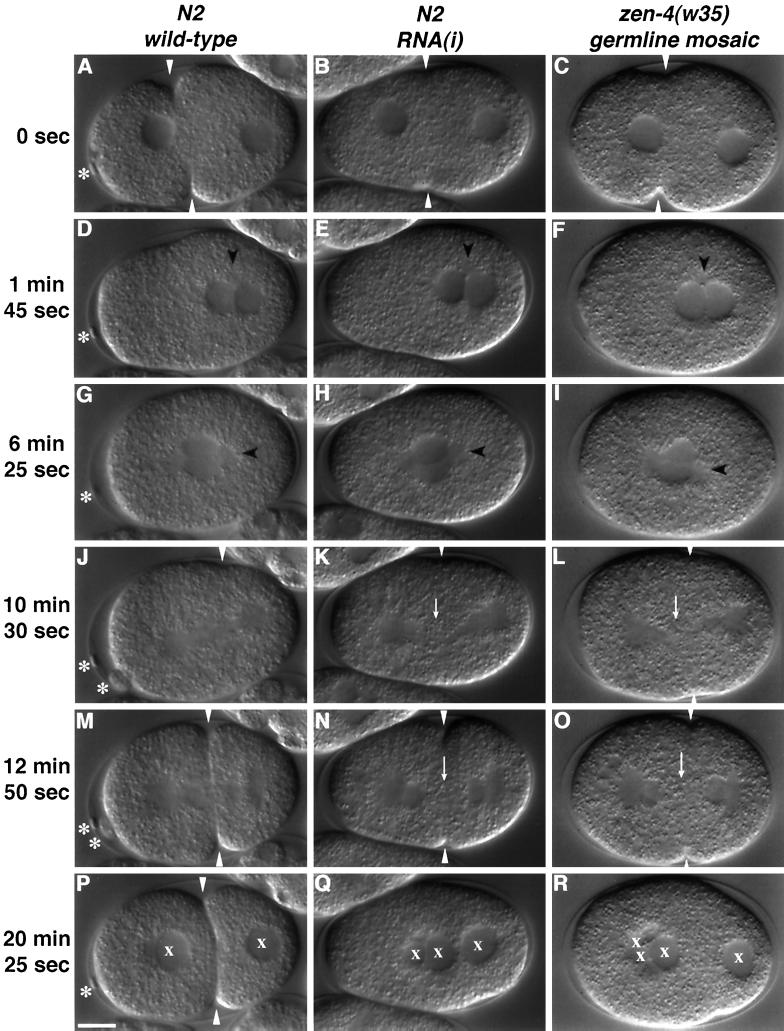
Figure 3.
Nomarski images selected from time-lapse recordings of embryos at successive stages between fertilization and first cleavage. Embryos deprived of ZEN-4 display a late defect in cytokinesis. The left column shows a wt offspring of an N2 animal, the center column shows the offspring of an N2 animal injected with antisense zen-4 RNA, and the right column shows the offspring of a zen-4(w35) homozygote that lost expression of the rescuing transgene pBR938 in the germline. In all panels, anterior is to the left. (A–C) Pseudocleavage and pronuclear migration. The white arrowhead points to the pseudocleavage furrow. The asterisk in panel A highlights the visible polar body; both polar bodies are visible in panel M. Embryos deprived of ZEN-4 fail to extrude polar bodies. (D–F) Pronuclear contact. The timing and position of pronuclear contact in wt (D) and mutant (E and F) embryos is very similar and was used to normalize the time-lapse recordings. Centrosomes are visible as granule-free regions and are labeled with a black arrowhead. (G–I) Pronuclear migration and rotation are unaffected by loss of ZEN-4. (J) Late anaphase and the beginning of first cleavage. A white arrowhead points to the cleavage furrow. (K and L) Spindle elongation is unaffected in embryos deprived of ZEN-4. A white arrowhead points to a region in the central spindle apparently devoid of organized microtubules. (M) Telophase. Microtubules in the spindle midzone can be seen bisecting the maturing cleavage furrow. (N and O) The cleavage furrow fails to propagate in the region of the central spindle. A white arrow points to a granular region at the center of the mitotic spindle lacking organized microtubules. (P) A two-cell embryo. An “x” is used to label each nucleus. (Q–R) The cleavage furrow has completely relaxed. Nuclei aggregate in the center of the embryo. The failure to extrude polar bodies may explain the excess number of nuclei. Note that loss of a rescuing array and RNA interference result in an indistinguishable phenotype. Scale bar, 10 μm.

