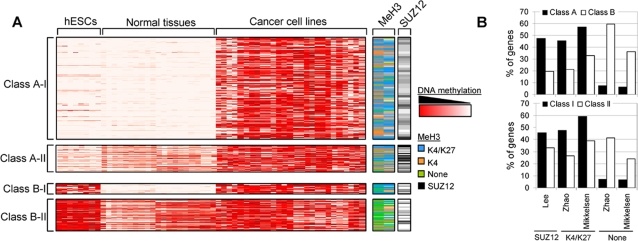
Figure 1. DNA methylation profiling in human embryonic stem cells (hESCs), normal primary tissues, and cancer cell lines.
(A) Methylation profiles of Class A-I (350), A-II (94), B-I (20), and B-II (107) genes in hESCs (8), normal (21), and cancer (21) samples obtained by Illumina arrays. The methylation levels vary from fully methylated (red) to fully unmethylated (white). The right-hand columns show the methylation status of histone H3 and Polycomb occupancy of the same genes obtained from previously published data [5], [12], [16]. Blue, methylation at K4 and K27; orange, methylation at K4 alone; green, no methylation at K4 or K27; black, presence of the Polycomb protein SUZ12. (B) Enrichment of the Polycomb protein SUZ12, the bivalent chromatin signature (K4/K27) or the absence of both marks (none) in Class A and Class B genes (upper panel) and Class I and Class II genes (lower panel).

