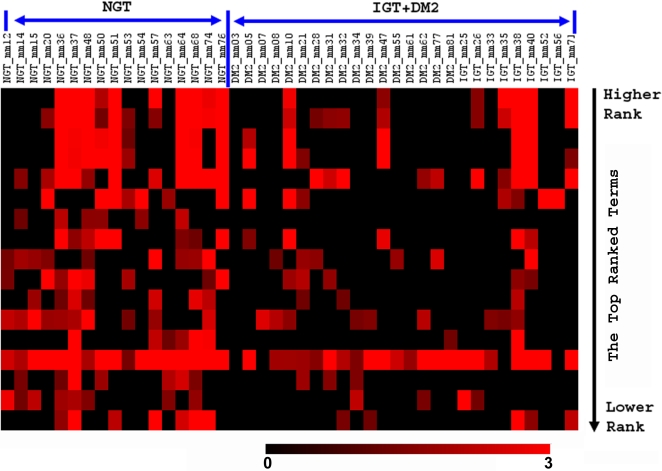
Figure 2. Heatmap of enrichment scores in all samples from NGT versus IGT and DM2 for the top 17 ranked terms of SLEPR result listed in Table S2.
The enrichment scores, which in general derived from Fisher's exact test p-value using formula (−Log10(p-value)), were floored to 0 if the ListHits<2 or p-value>0.05. The rows of the heatmap are the ranked terms in the same order as in Table S2 (Top 7 of them shown in Table 1) from top to bottom with the higher ranks at the top. The gradient of red color in heatmap indicated the enrichment levels.

