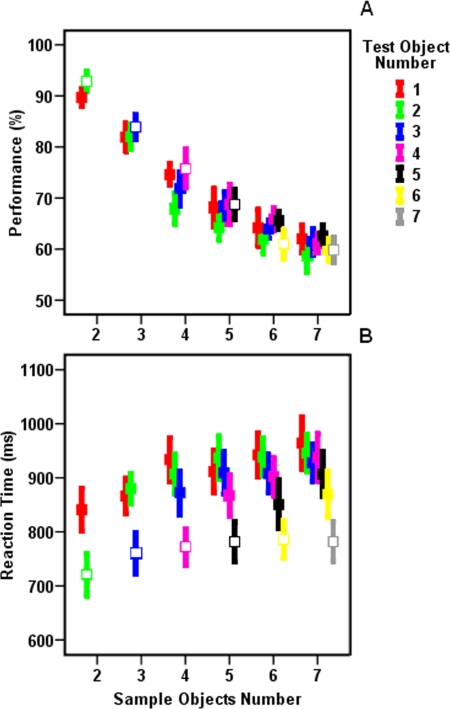
Figure 2. Participants' response accuracy (a) and RT (b) in different experimental conditions.
Participants' performance declined as the number of sample objects increased (p<0.001) while participants' RT was mainly affected by the trial type (p<0.001). In both graphs open and closed squares correspond to whole report and partial report trials respectively. Error bars represent one standard error.

