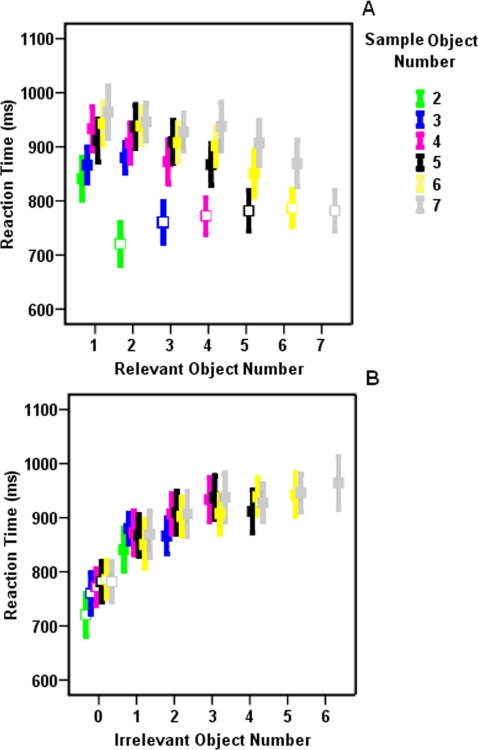
Figure 3. The relation between participants' RT and the number of (a) relevant and (b) irrelevant objects.
Pearson test of correlation showed that there was a significant correlation between participants' RT and the number of relevant (r = −0.204, p<0.001) and irrelevant (r = 0.401, p<0.001) objects. Importantly, subsequent Pearson test for comparing two correlation coefficients yielded that participants RT is significantly better correlated to irrelevant objects number (p<0.01). Open and closed squares correspond to whole report and partial report trials, respectively. Error bars represent one standard error.

