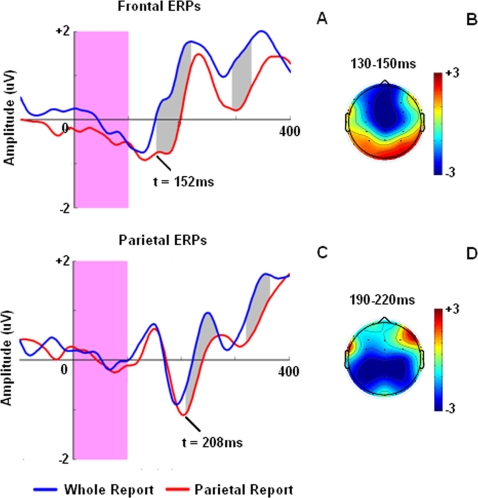
Figure 4. Early (first 400ms) ERP activities recorded in frontal (a) and parietal (c) leads after test onset.
Activity mappings also demonstrate distribution of frontal (b) and parietal (d) activities during 130–150ms and 190–220ms after the test onset respectively. These timings correspond to averaged frontal N150 and parietal N200 peak latencies. Blue and red lines correspond to whole report (WR) and partial report (PR) trials, respectively. Pink bar in both graphs represents test stimulus presentation time. Gray areas depict the period with a significant difference between ERP area under curve of WR and PR trials (p<0.05).

