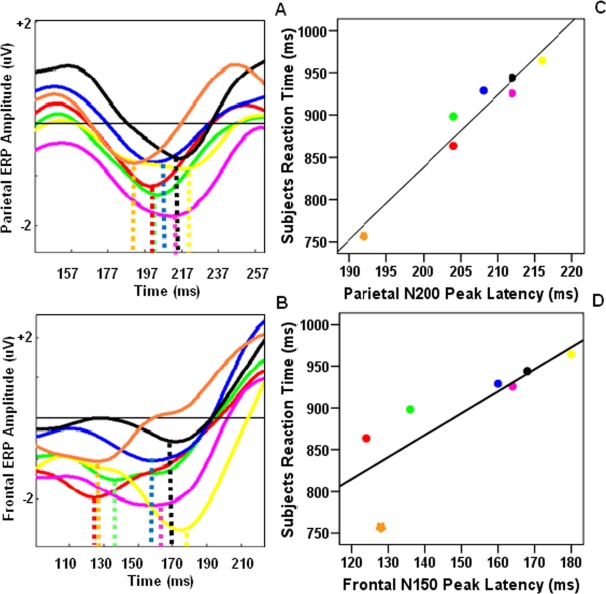
Figure 5. The relation between the parietal N200 (a, c) and frontal N150 (b, d) peak latencies and the participants' RT.
Plots represent the ERP activities (left) and the corresponding scatter plots of their peak times (right). In both brain regions the peak latency of the ERP components increased with increasing the number of irrelevant objects and correlated with participants' RT. In scatter plots asterisks demonstrate values corresponding to whole report (WR) trials and squares depict values of partial report (PR) trials. The numbers close to each square show the amount of irrelevant load in each PR trial. Colour legends are the same for the scatter plots and the ERP plot. Lines in part c and d demonstrate the regression line.

