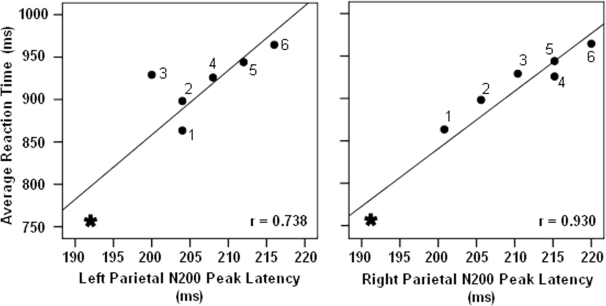
Figure 6. The relation between the parietal N200 peak latencies recorded in left (a) and right (b) hemispheres and the participants' RT.
Parietal N200 peak latency in right hemisphere showed better correlation to participants' RT. Each symbol depicts values related to whole report (asterisk) and partial report trials (square) and the lines regression line.

