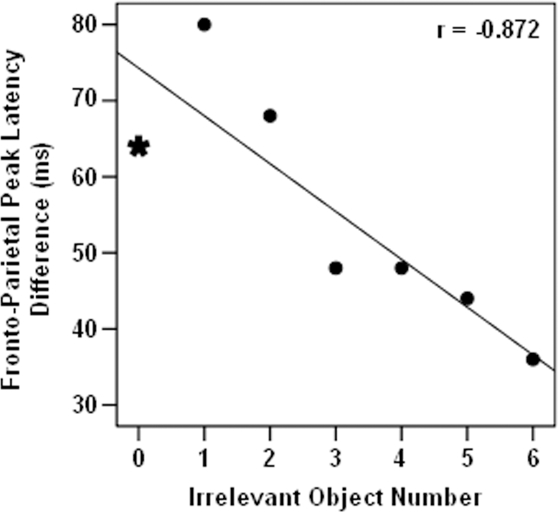
Figure 7. The difference between peak latencies of frontal N150 and parietal N200.
The interval between the latency of these two ERP components decreased when the number of irrelevant objects increased (Pearson test of correlation, r = −0.872, p = 0.01). Symbols and lines represent are similar to figure 6.

