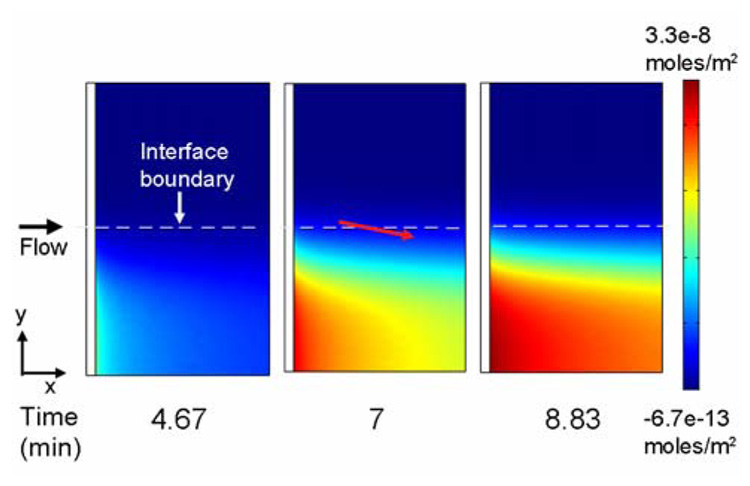
Figure 3.
Surface concentration of bound antibody over time. The solution analyte and antibody concentrations were set to 100 nM. The red arrow indicates the direction of the slope in the binding profile of antibody to the surface due to the continued formation and diffusion of complex above the immobilized analyte. The results present a 1 mm (x-dimension) × 1.6 mm (y-dimension) region of the binding surface located in the center of the 3 mm wide (y-dimension) microchannel.

