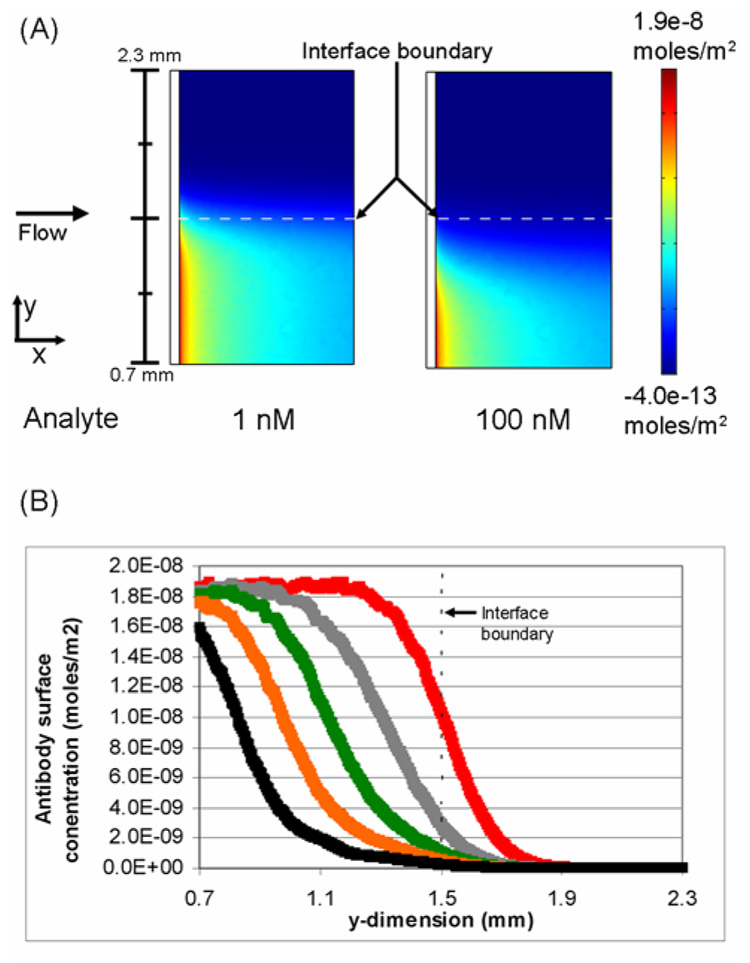
Figure 4.
Influence of the concentration of analyte on the surface concentration of antibody. (A) Comparison of the surface binding profiles of antibody when the analyte concentration is 1 nM and 100 nM. The black bar at the left indicates the actual y-dimension distance within the microchannel. (B) The surface concentration of antibody as a function of position in the y-dimension at the leading edge of the binding surface. The analyte concentrations plotted are 0 (+), 100 (+), 250(+), 500 (+), and 1000 (+) nM.The concentration of antibody is 100 nM and t=4.67 minutes.

