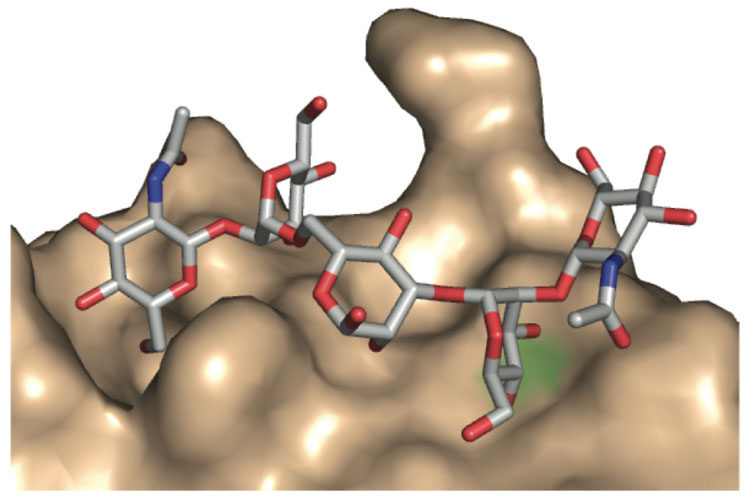
Figure 4.
Model of Ca2+-dependent binding of GlcNAc2Man3 to DC-SIGN that illustrates the carbohydrate binding site. Hydroxyl groups from the oligosaccharide bind the Ca2+ ion (green). This structure was determined by x-ray crystallography by the Weis and Drickamer groups (reference 58).The figure was generated using Pymol with the PDB entry 1K9I.

