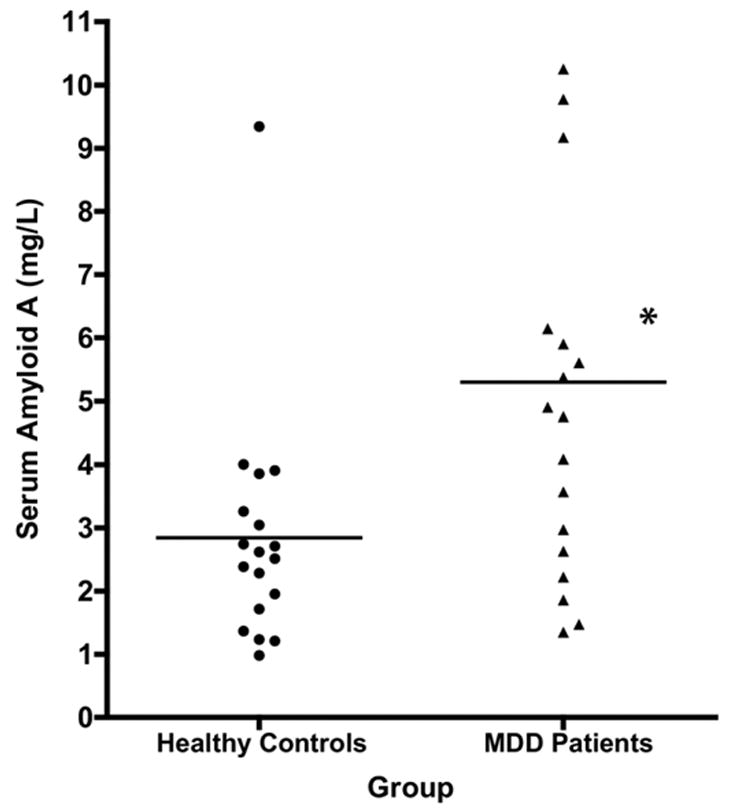
Figure 1.

Serum amyloid A (SAA) levels in serum of remitted, unmedicated women with major depressive disorder (MDD) versus body mass index (BMI)-matched female healthy control subjects (HCS). Points represent the mean of two fasting am SAA levels obtained on two different dates, at least six days apart, in 18 MDD women and 18 HCS. Horizontal bars represent group means. * p < .005 versus controls by paired t-test.
