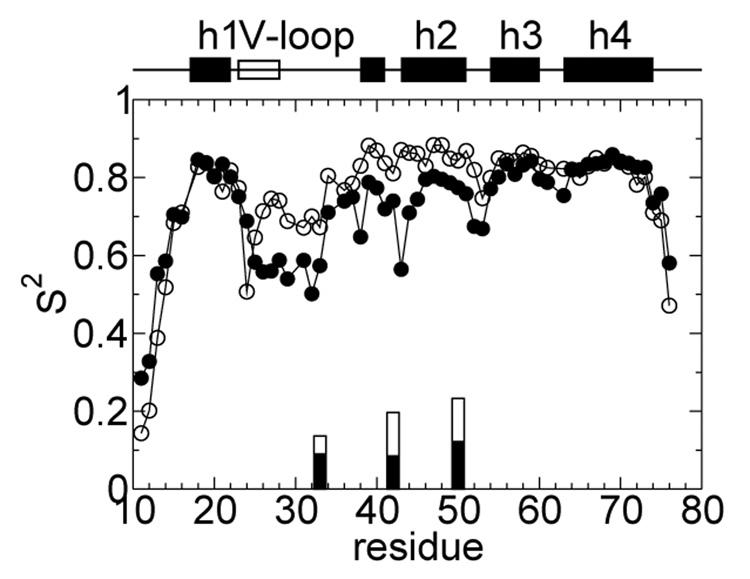
Figure 3.
Computed NMR order parameters (S2) are plotted against amino acid sequence for state 1 (open) and 2 (filled symbols). The back-bone N-H order parameters are represented as circles while the methyl C-H parameters are represented as bars. For the latter, only those within the N-terminal and interface hydrophobic clusters displaying significant changes (> 25%) are shown.

