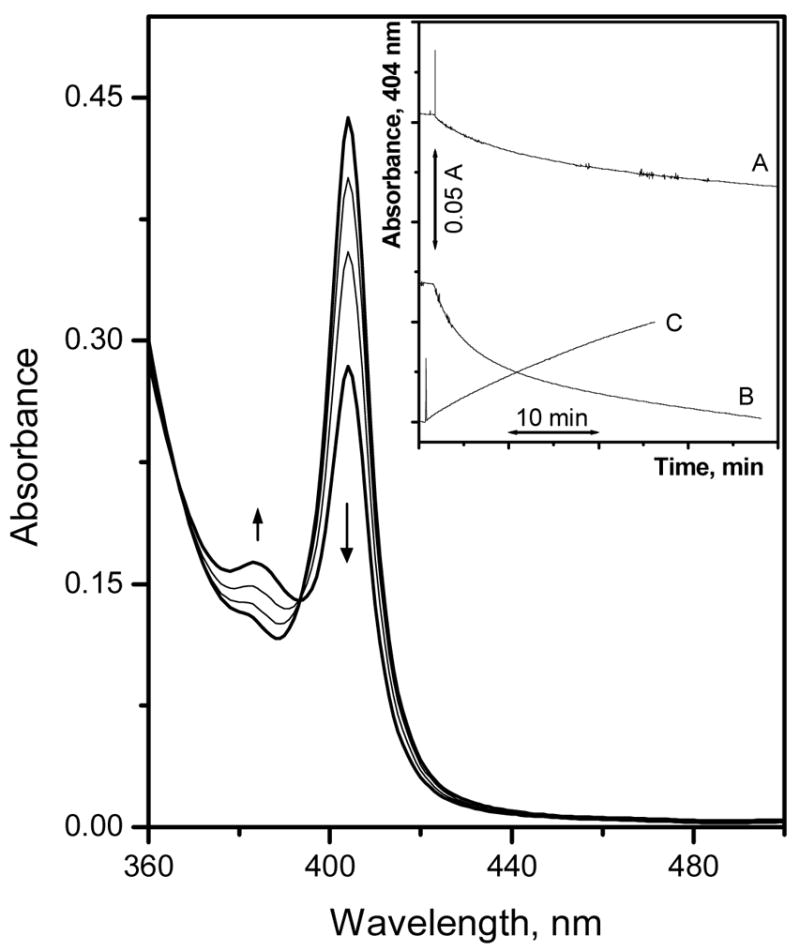
Fig. 2.

Absorption spectra of Film-3, measured in 50 mM glycine-phosphate buffer, pH 3.00, equilibrated with different fluoride concentrations: 5.5 μM, 0.53, 5.0, and 48 mM (from top to bottom at 404 nm). The inset shows the fluoride response time trace when changing the fluoride concentration from 5.5 μM to 0.53 mM (A), 5.0 to 48 mM (B), and the recovery time when changing the sample from 48 mM fluoride to buffer free from fluoride ions(C).
