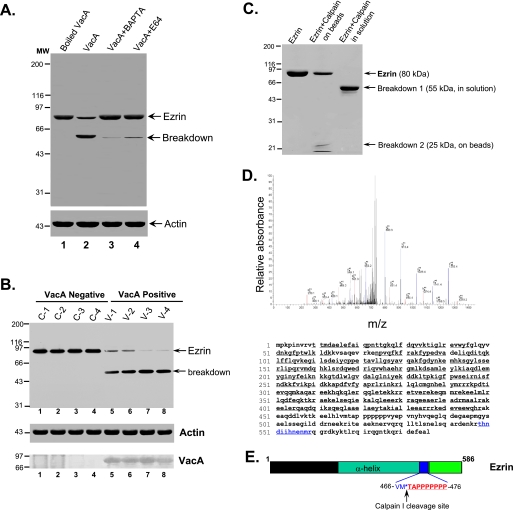
FIGURE 3.
VacA treatment induces a Ca2+-dependent cleavage of ezrin at Met469-Thr470. A, aliquots of gastric glands were pretreated with E64d, BAPTA-AM, or vehicle for 5 min, followed by incubation with VacA (5 μg/ml) for 20 min in the presence of 1.8 mm Ca2+. An aliquot of glands was treated with boiled VacA. Glandular cells were then collected and solubilized in SDS-PAGE sample buffer. Equivalent amounts of proteins from these gland samples were applied to SDS-PAGE and subsequently transblotted onto nitrocellulose membrane. The blot was probed for ezrin and actin using an ECL kit (Pierce). B, ezrin is hydrolyzed in VacA-infected human biopsies from dyspeptic patients. An aliquot of human gastric biopsies from VacA-positive patients (V1-V4) and negative control patients (C1-C4) were homogenized in SDS-PAGE sample buffer. Equivalent amounts of proteins from these gland samples were applied to SDS-PAGE and subsequently transblotted onto nitrocellulose membrane. The blot was probed for ezrin (top), actin (middle), and VacA (bottom) using an ECL kit (Pierce). Note that hydrolysis of ezrin from an intact 80 kDa band to a typical calpain-cleaved 55 kDa band seen only in VacA-positive biopsies (lanes 5-8) correlated with the presence of VacA from those biopsies (lanes 5-8). C, histidine-tagged ezrin proteins were expressed in bacteria and purified using nickel-agarose beads as described under “Materials and Methods.” Equivalent amounts of ezrin proteins (50 μg) were incubated with 0.1 μg of purified calpain I at 25 °C for 5 min, followed by separation on 6-16% gradient SDS-PAGE and staining with Coomassie Blue. The visualized proteins included ezrin, a 55-kDa breakdown product, and a 25-kDa breakdown product. The 55 and 25 kDa protein bands were excised for in-gel digestion and subsequent mass spectrometric analyses (D). Ezrin proteins from a duplicate SDS-polyacrylamide gel were transblotted onto polyvinylidene difluoride membrane, and the 25 kDa band was microsequenced (E). D, representative liquid chromatography-tandem mass spectrometry spectra of a tryptic fragment derived from the 25-kDa breakdown product of ezrin (THNDIIHNENMR) (top) and highlighted peptide sequence (bottom). E, schematic diagram of microsequencing results (sequencing data are listed in Fig. S1).

