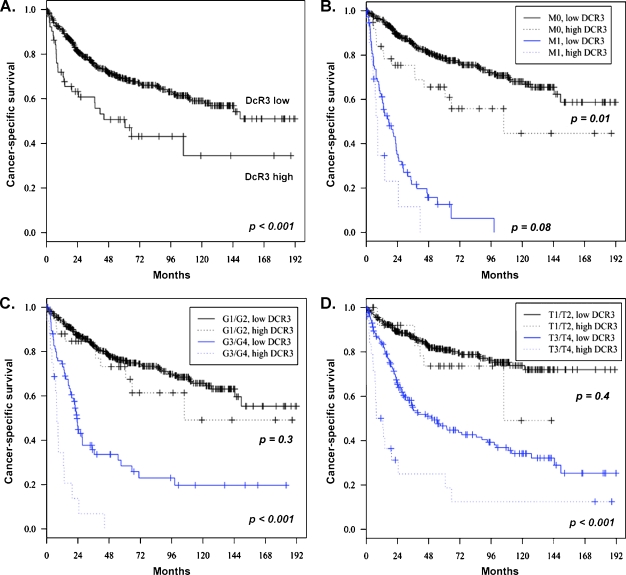
Figure 2.
Analysis of cancer-specific survival depending on DcR3 expression levels. (A) All patients (n = 560). (B) Patients with nonmetastatic disease (M0, n = 473) versus metastatic disease (M1, n = 87). (C) Patients with high-grade RCCs (G3/G4, n = 92) versus low-grade RCCs (G1/G2, n = 465). (D) Patients with extended primary tumor (T3/T4, n = 197) versus limited primary tumor (T1/T2, n = 363).

