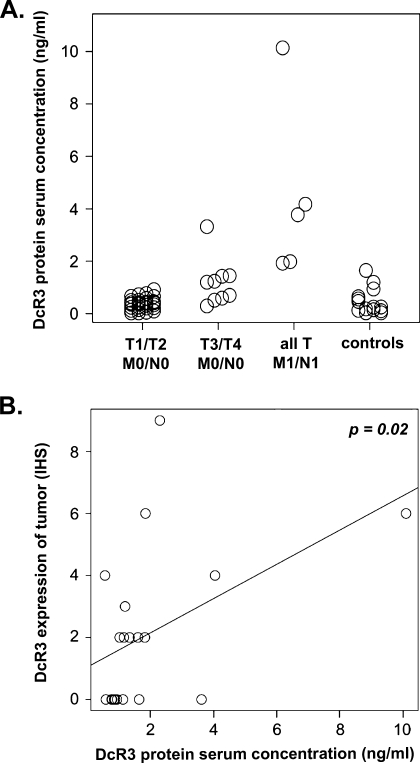
Figure 3.
(A) Comparison of DcR3 serum levels in patients (n = 42; for clinical and pathologic features, see Table W3) with low stage localized disease, high-stage localized disease, metastatic disease, and in normal individuals. Compared to controls, DcR3 levels were significantly higher in patients with high-stage localized disease (P = .007) as well as metastasized disease (P = .001). In contrast, DcR3 serum concentrations were not significantly higher in patients with low-stage localized disease (P = .7) compared to healthy control individuals. (B) Comparison between DcR3 serum concentrations and DcR3 expression in RCCs (n = 20; for clinical and pathologic features, see Table W4). The DcR3 expression levels are presented as IHSs.

