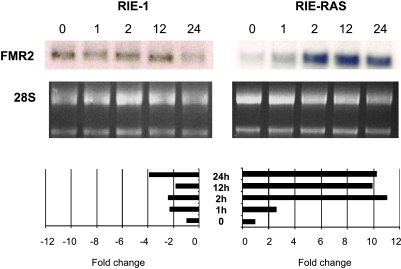
Figure 2.
RIE and RIE-Ras Northern blots show differential expression of FMR2 in response to TGFβ1. The RIE gene expression array showed inhibition of FMR2 expression after 1 hour of incubation with 2 ng/ml TGFβ1, whereas the RIE-Ras(12V) array showed activation of FMR2 gene expression. These findings were supported by Northern blot analysis of FMR2 gene expression as shown in the top panel. In the middle panel, equivalent RNA loading was confirmed verified by ethidium bromide staining of 18 and 28S ribosomal RNA. RNA induction by TGFβ1 was quantified by scanning the autoradiographs and analyzing band intensity with densitometry (bottom panel). Results from these Northern blots are consistent with FMR2 expression results obtained in the microarray experiments and show a marked differential effect on FMR2 expression, with 11-fold maximal induction in Ras-transformed cells and a fourfold repression in the parental cell line. In these graphs, band intensity is reported as the signal at any given time point relative to the signal of the control RNA or “0 hour” sample.

