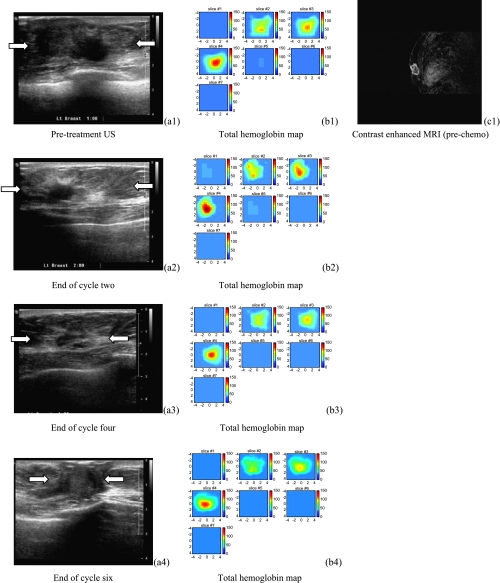
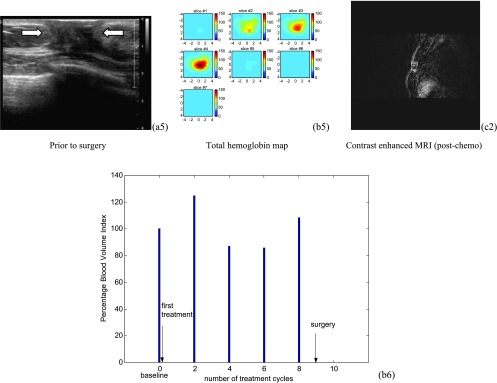
Figure 5.
US images of a low-grade infiltrating ductal carcinoma (patient 11) shown in the left column of (a1) to (a5). The tumor margins shown in the first three US images were not well defined but were better delineated in the last two images (88% reduction from pre- to posttreatment). The middle column of (b1) to (b5) shows corresponding hemoglobin maps from pretreatment (b1) to posttreatment (B5), which reveal substantial blood volume near the chest wall (third slice) throughout the treatment. In each tHb map, seven slices correspond to spatial a image of 9 cm x 9 cm obtained starting at 0.2 cm underneath the skin surface to 3.2 cm deep toward the chest wall with 0.5 cm spacing in depth. (b6) plots the corresponding %BVI from baseline to preoperative assessment every two cycles and no reduction in %BVI was observed. The left column shows postcontrast subtracted MRI images of pretreatment (c1) and posttreatment (c2), respectively. Volume reduction from MRI images is 16%. This patient received a mastectomy and the pathologic residual tumor was 3.3 x 2.8 x 1.2 cm extending to the skin and pectoralis muscle.


