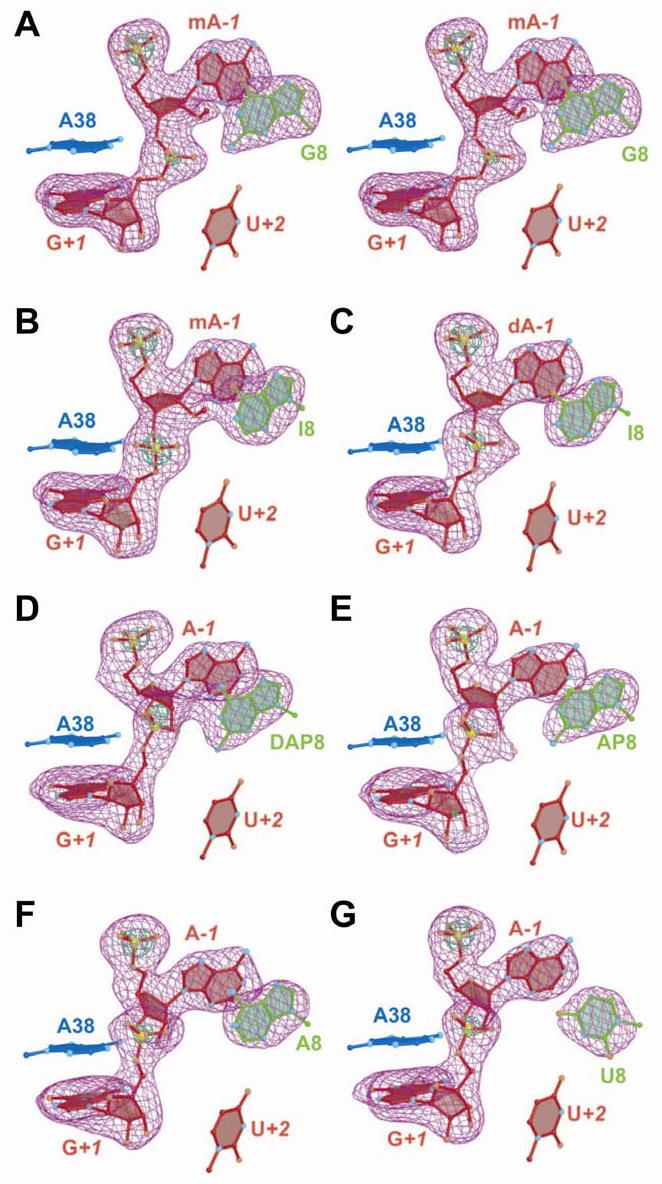
FIGURE 2.

Representative simulated annealing omit electron density maps for the scissile bond and position 8 of the hairpin ribozyme. Maps have σA coefficients of type (m|Fo| - D|Fc|). Nucleotides A−1 and G+1, as well as the base moiety at position 8, were removed from the phase calculation. The orientation is rotated 180o about the z-axis compared to Figure 1B. Bases of A38 and U+2 are shown for perspective. Electron density is contoured at the 3σ (purple) and 9σ levels (green) unless specified otherwise. (A) Stereo diagram of the native structure at 2.05 Å resolution. The label mA−1 indicates a 2'-OMe group at this position. The green contour level is 10σ. (B) The G8I structure at 2.33 Å resolution. The green contour level is 10.5 σ. (C) The G8I/2'-deoxy A−1 structure at 2.40 Å resolution with a 2'-deoxy substitution at position A−1. (D). The G8DAP structure at 2.40 Å resolution. The A−1 position is a ribonucleotide. The green contour level is 6.0 σ. (E) The G8AP structure at 2.70 Å resolution. The green contour level is 7.0 σ. (F) The G8A structure at 2.40 Å resolution. (G) The G8U structure at 2.38 Å resolution The green contour level is 10.0 σ.
