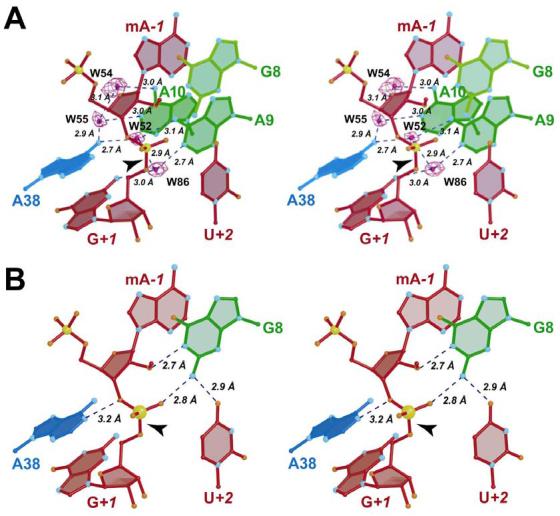
FIGURE 3.

Stereo view of ball-and-stick diagrams of the hairpin ribozyme active site for the G8 native structure. Putative H-bond interaction distances are depicted with broken blue lines. (A) Schematic diagram of the native active site depicting solvent atoms (W) in contact with bases G+1, A9, A10 and A38. A simulated annealing omit electron density map with coefficients (m|Fo| - D|Fc|) is shown in which the four waters were eliminated from the phase calculation. The map is contoured at the 6σ level. (B) Schematic view of the native G8 structure with contacts to the scissile bond from neighboring residues. These coordinates provide the reference orientation for all other superpositions of this study except where noted.
