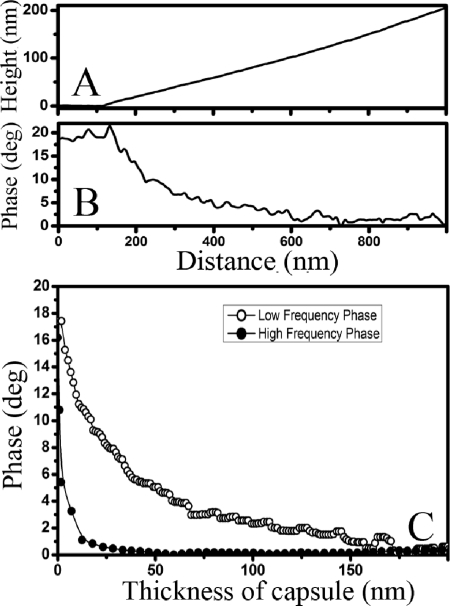
FIG. 4.
(A and B) Profiles of the topography and phase images collected in low-frequency (21-kHz) tapping mode measured along the black line in Fig. 3B and the white line in Fig. 3F, respectively, for a P. aeruginosa FRD1 bacterial cell. (C) Dependence of the phase angle measured in AFM phase images on the thickness of the bacterial capsule of the same P. aeruginosa FRD1 bacterial cell, collected in both low-frequency (21-kHz) and high-frequency (300-kHz) tapping modes. Quantitatively similar results were obtained for S. oneidensis MR-4 bacteria.

