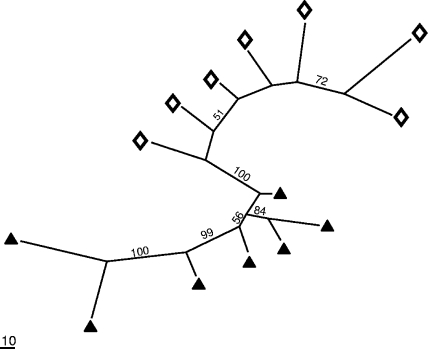
FIG. 4.
Similarity among active microbial communities displayed as the shortest unrooted maximum parsimony tree. The tree was computed with PAUP 4.0β10 (Sinauer Associates) as previously reported (23). Each terminal corresponds to the microbial community of a given sample; the closer they are, the more similar are their diversity signatures. Diamonds and triangles represent soil bacterial communities in 13C-RNA from glucose and acetate enrichments, respectively. Bootstrap values indicated at the nodes were computed from 500 pseudo-replicates. The scale bar corresponds to a gain/loss of 10 informative T-RFs.

