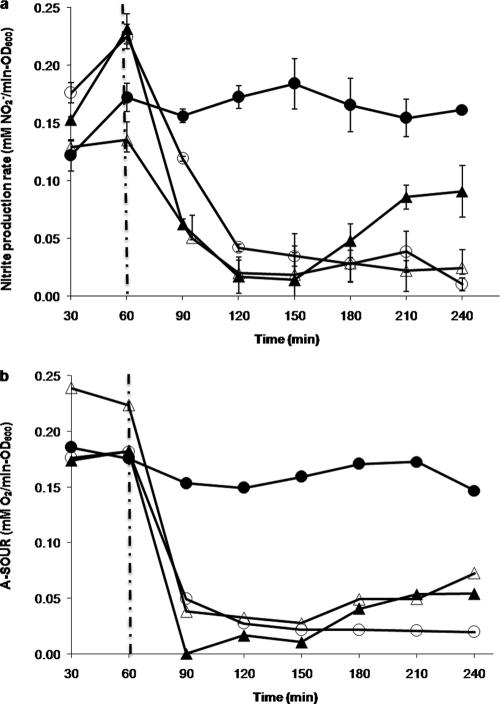
FIG. 1.
N. europaea nitrite production rate (a) and A-SOUR (b) under 1 μM CdCl2, 6 μM HgCl2, or 8 μM CuCl2 treatments for 4 h. Nitrite production rate and AMO activity were normalized by cell density. Closed circles, open circles, closed triangles, and open triangles represent control condition, 8 μM CuCl2, 6 μM HgCl2, and 1 μM CdCl2, respectively. The vertical dashed lines indicate the injection time of inhibitors. The error bars indicate 95% confidence intervals.

