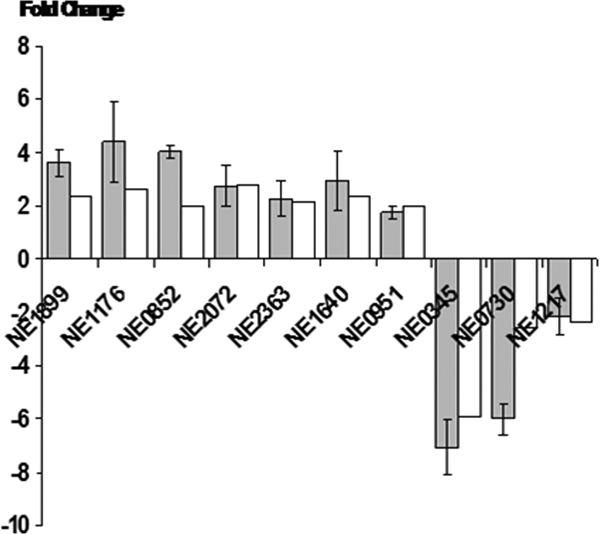
FIG. 2.

Comparison of mRNA expression levels of selected up- or downregulated genes determined by qRT-PCR (black bars) and microarray (white bars). The positive value represents upregulation, and the negative value represents downregulation. Error bars represent standard errors of the means.
