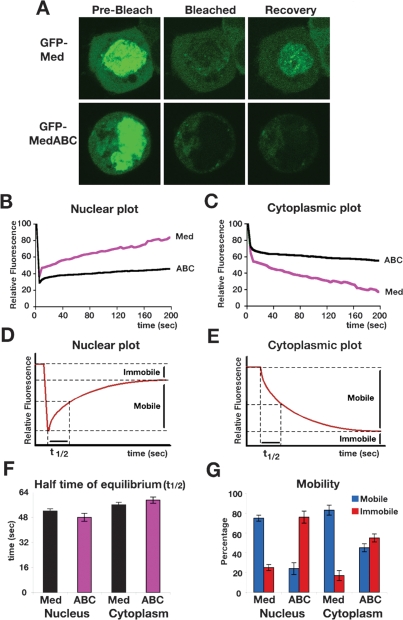
Figure 7.
SUMOylation promotes Med nuclear export. (A) Panels show representative prebleach, nuclear bleach, and recovery images from experiments on cells transfected with Tkv-QD, Mad, and GFP-Med or GFP-MedABC. The recovery images correspond to the 200-sec time point. (B,C) Graphs show quantification of Med and MedABC nuclear (B) and cytoplasmic (C) recovery, each averaged from eight cells. (D,E) Example nuclear (D) and cytoplasmic (E) kinetic plots with the Mobile, Immobile fractions, and t1/2 shown. (F) Graph shows half time of equilibration (t1/2) for the Med and MedABC FRAP data. (G) Graph shows the percentage of Mobile and Immobile Med or MedABC as calculated from the nuclear and cytoplasmic recovery experiments. Error bars are SEM throughout.

